

What are Chrome Developer Tools?
The Google Chrome browser includes a suite of web developer tools called Chrome DevTools. For web developers, they can be incredibly useful. These tools include:
1. Elements
2. Console
3. Sources
4. Network
5. Application
6. Security
7. Memory
8. Performance
9. Lighthouse
These tools provides real time information about the web page or application. Function of each of these is described below:
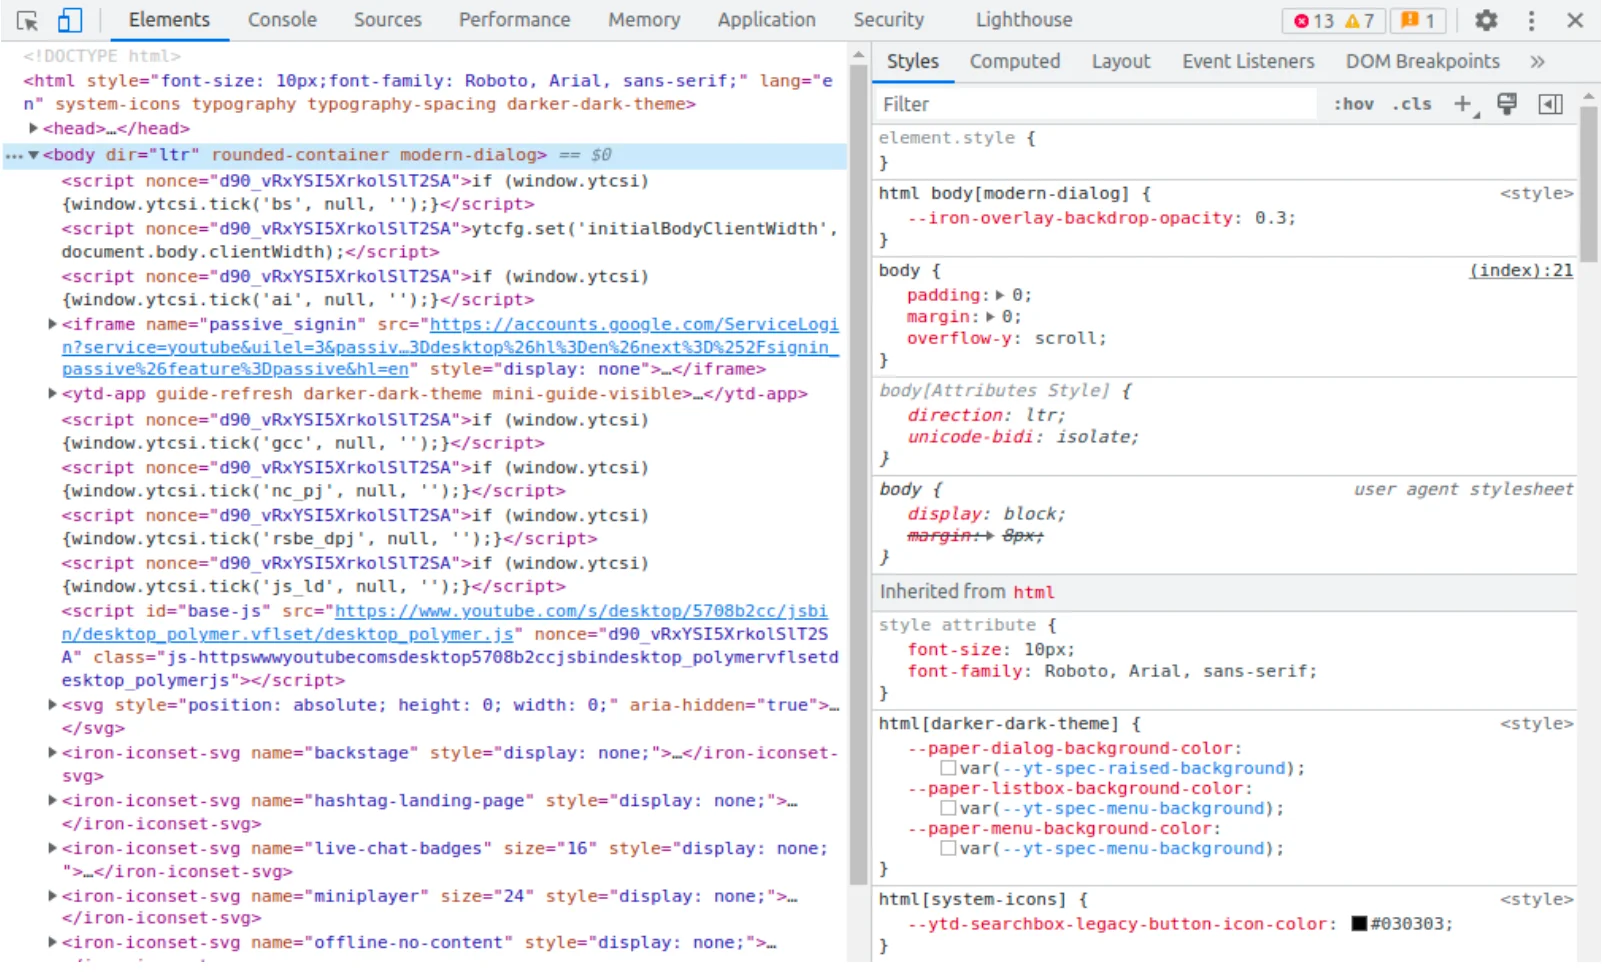
Elements
This tool allows us to inspect and edit the HTML and CSS of the web page. With the help of this tool, we can also add new elements to the web page. Although these changes are local and temporary, you can always reset them by refreshing the page.
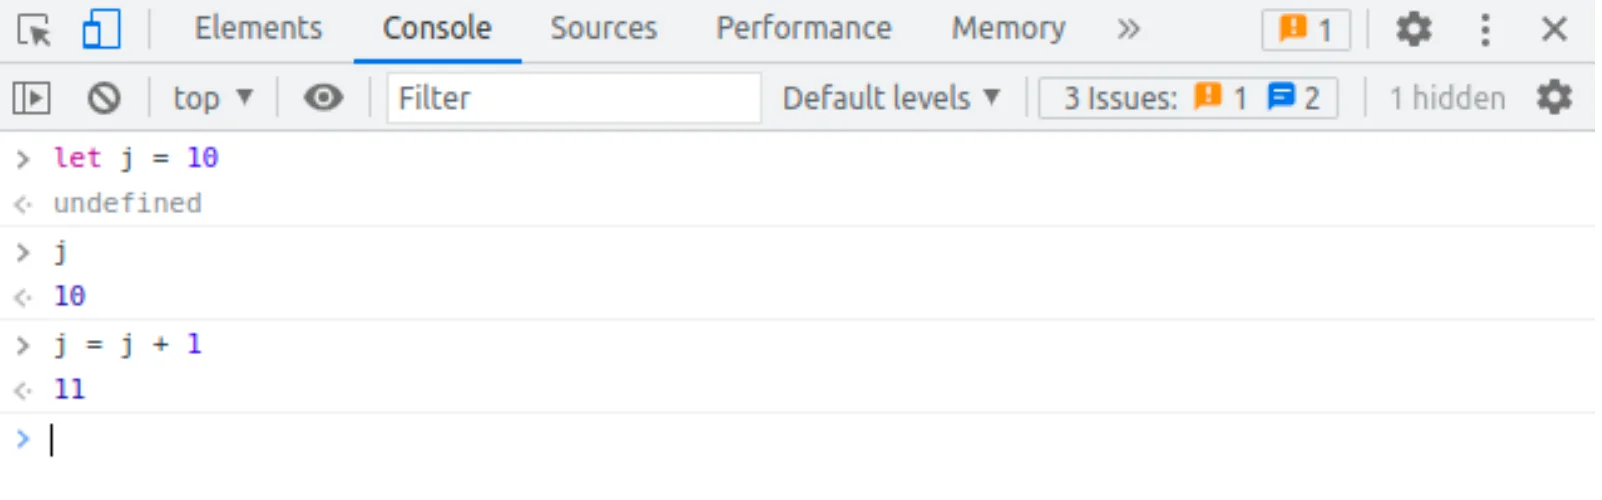
Console
You can run JavaScript code on your page using the Console panel. You can write or debug your code using the Console. It informs you of any interactive components present on a page. To interact with the web page, you’re reading, you can write JavaScript in Console. You can also write messages to yourself in the JavaScript of websites you’re constructing. Those messages will appear in the Console to demonstrate that the JavaScript code was executed. This tool is handy while debugging.
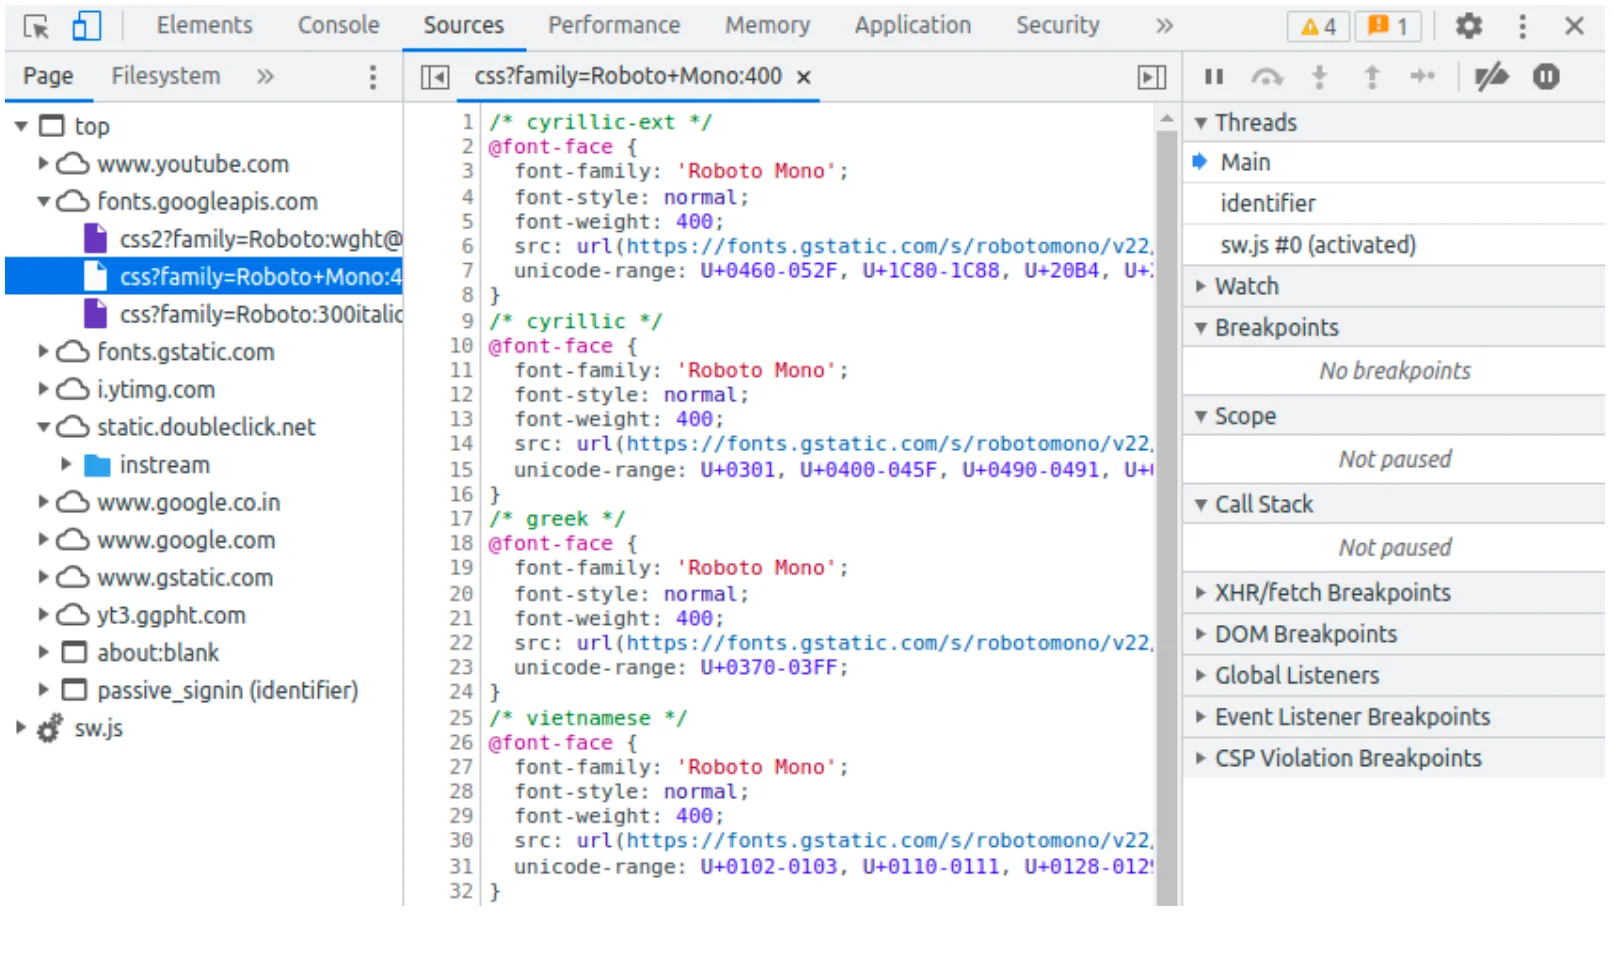
Sources
You may inspect and modify your page’s CSS and JavaScript code in the Sources section. You can set breakpoints, step through code, and view the values of variables using the Sources panel.
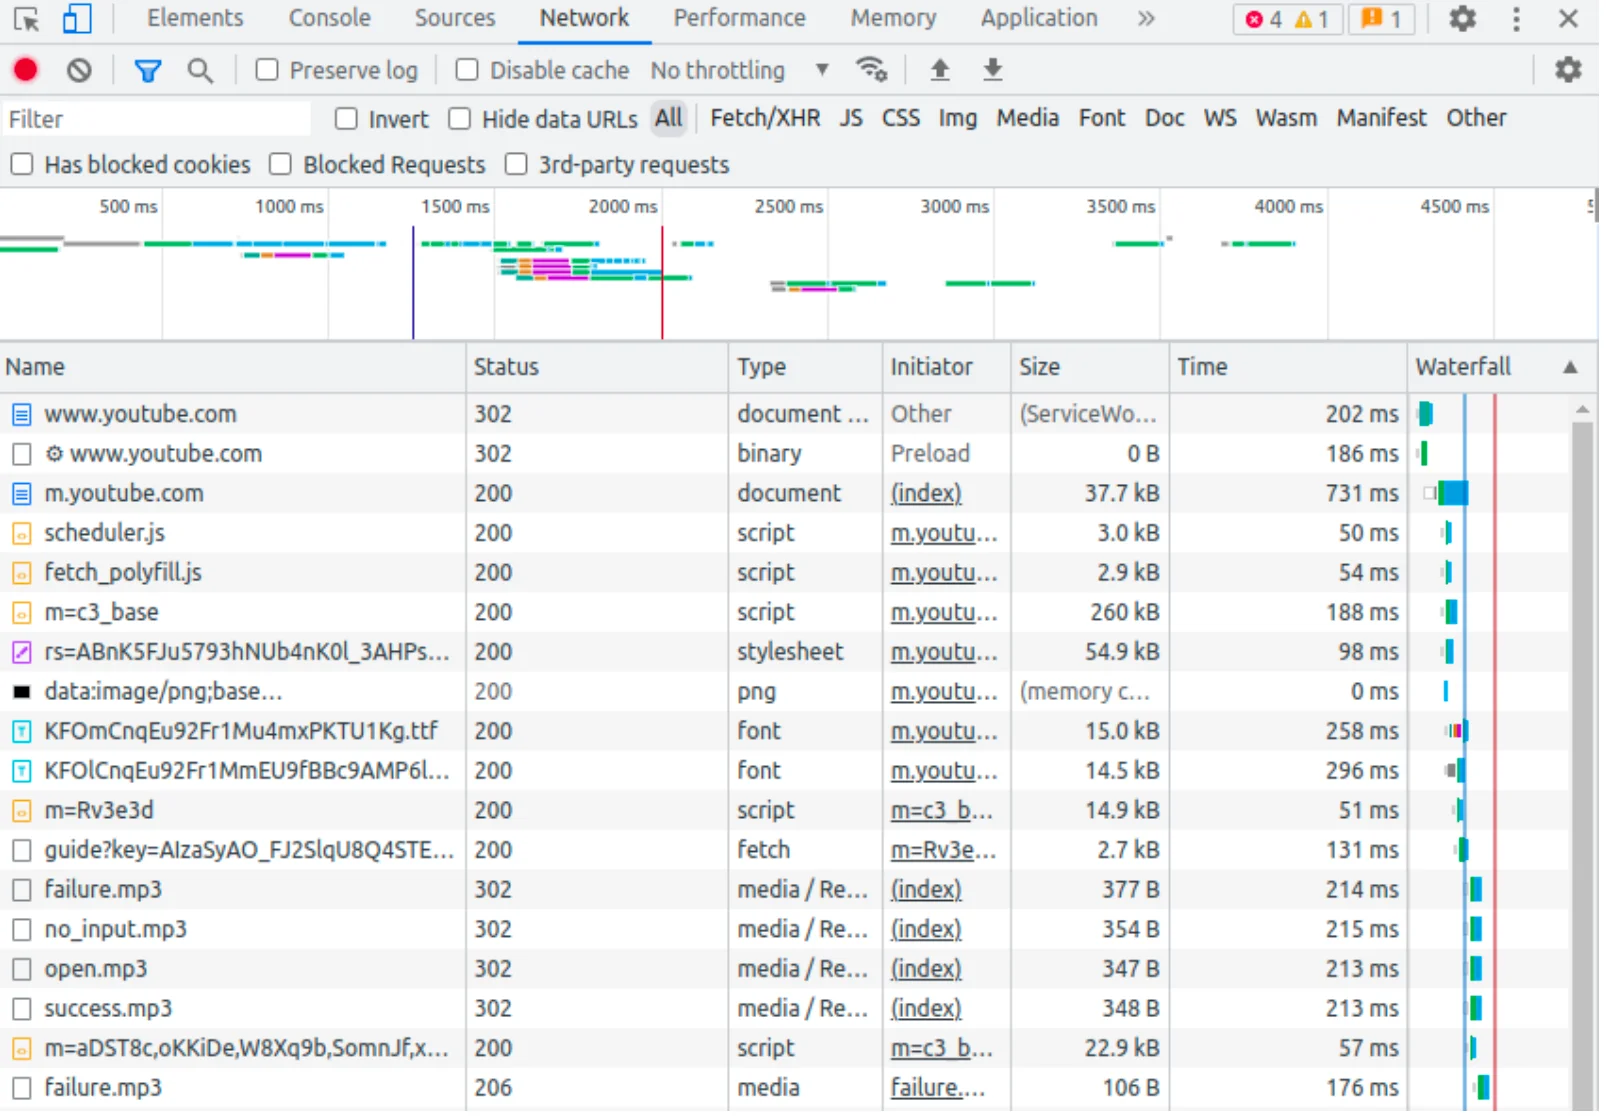
Network
You may observe how your page is loading using the Network panel. You can view what resources are being loaded and how long each resource will load using the Network panel. Also, you can inspect different types of connections established by the web page.
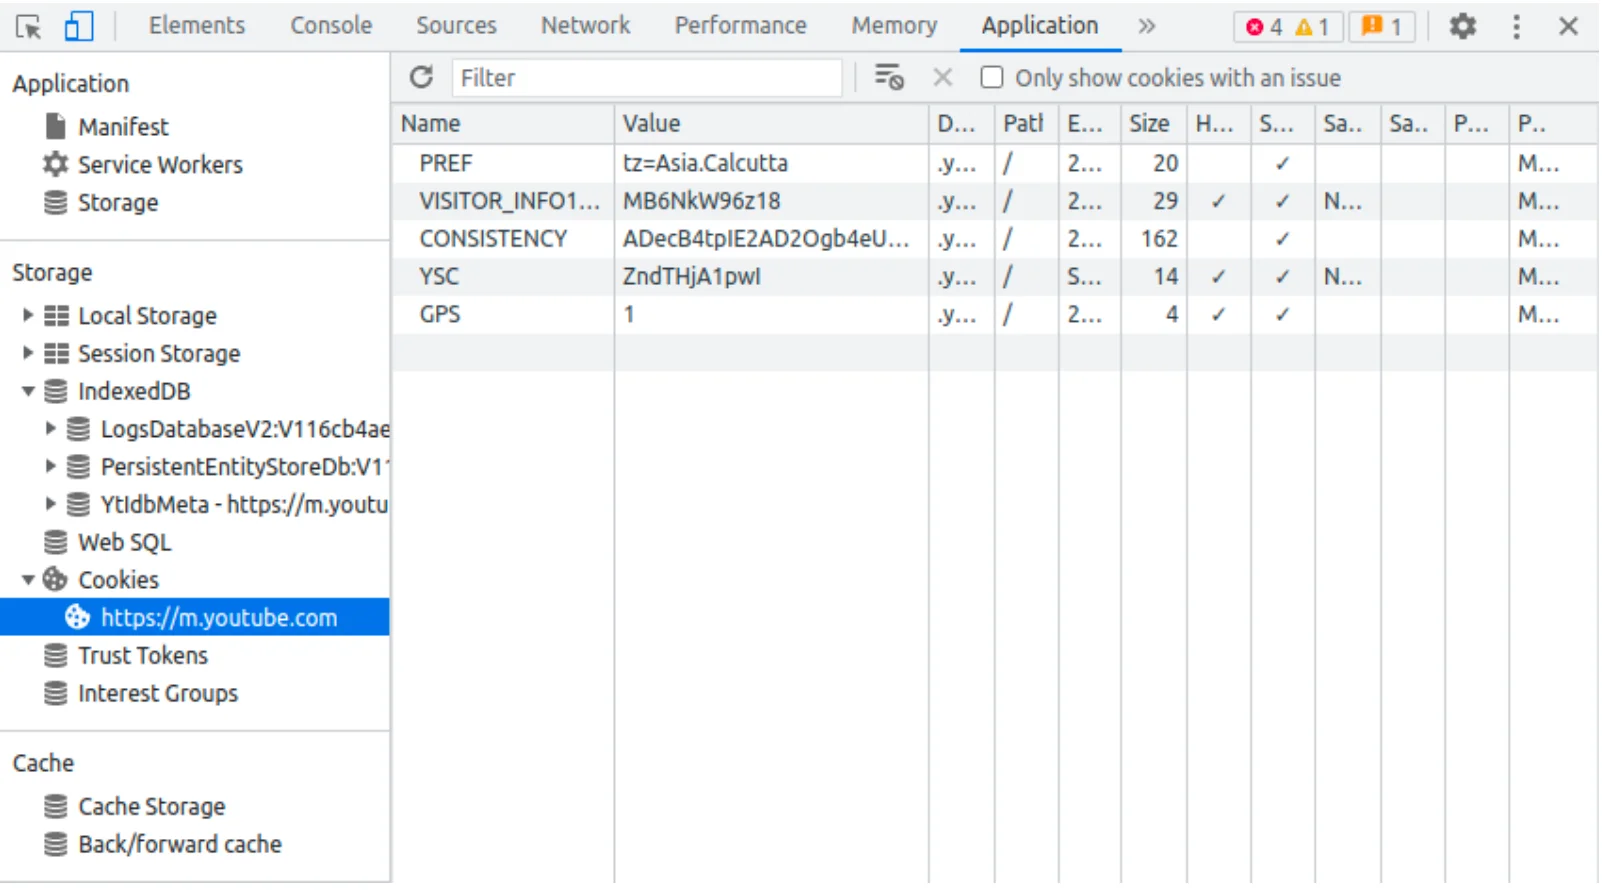
Application
The resources that make up your web application can be inspected using the Application panel. You can also check what files are loaded, as well as what cookies and local storage.
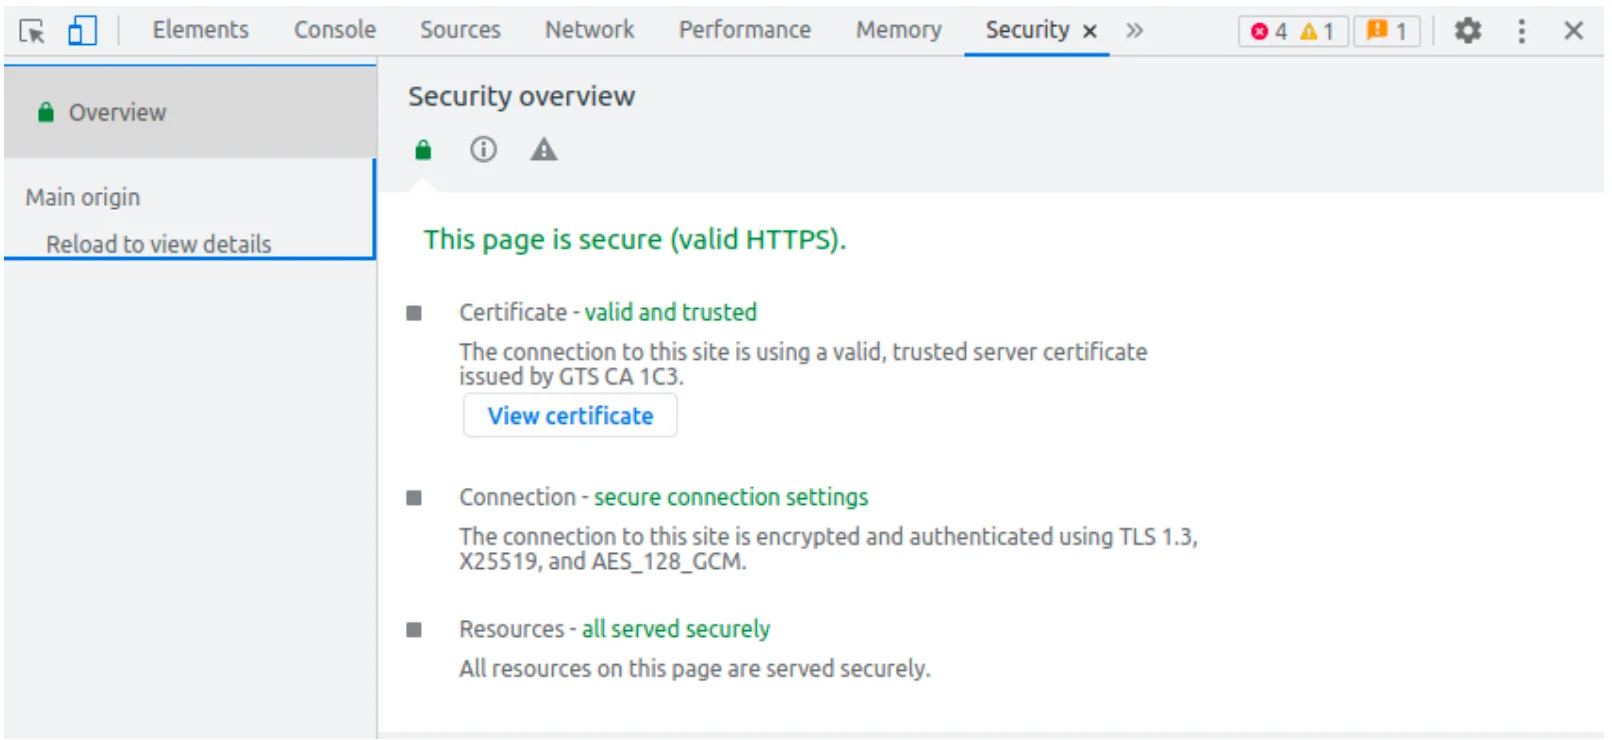
Security
You may examine the security options on your website using the Security panel. You may check your page’s permissions and any security flaws.
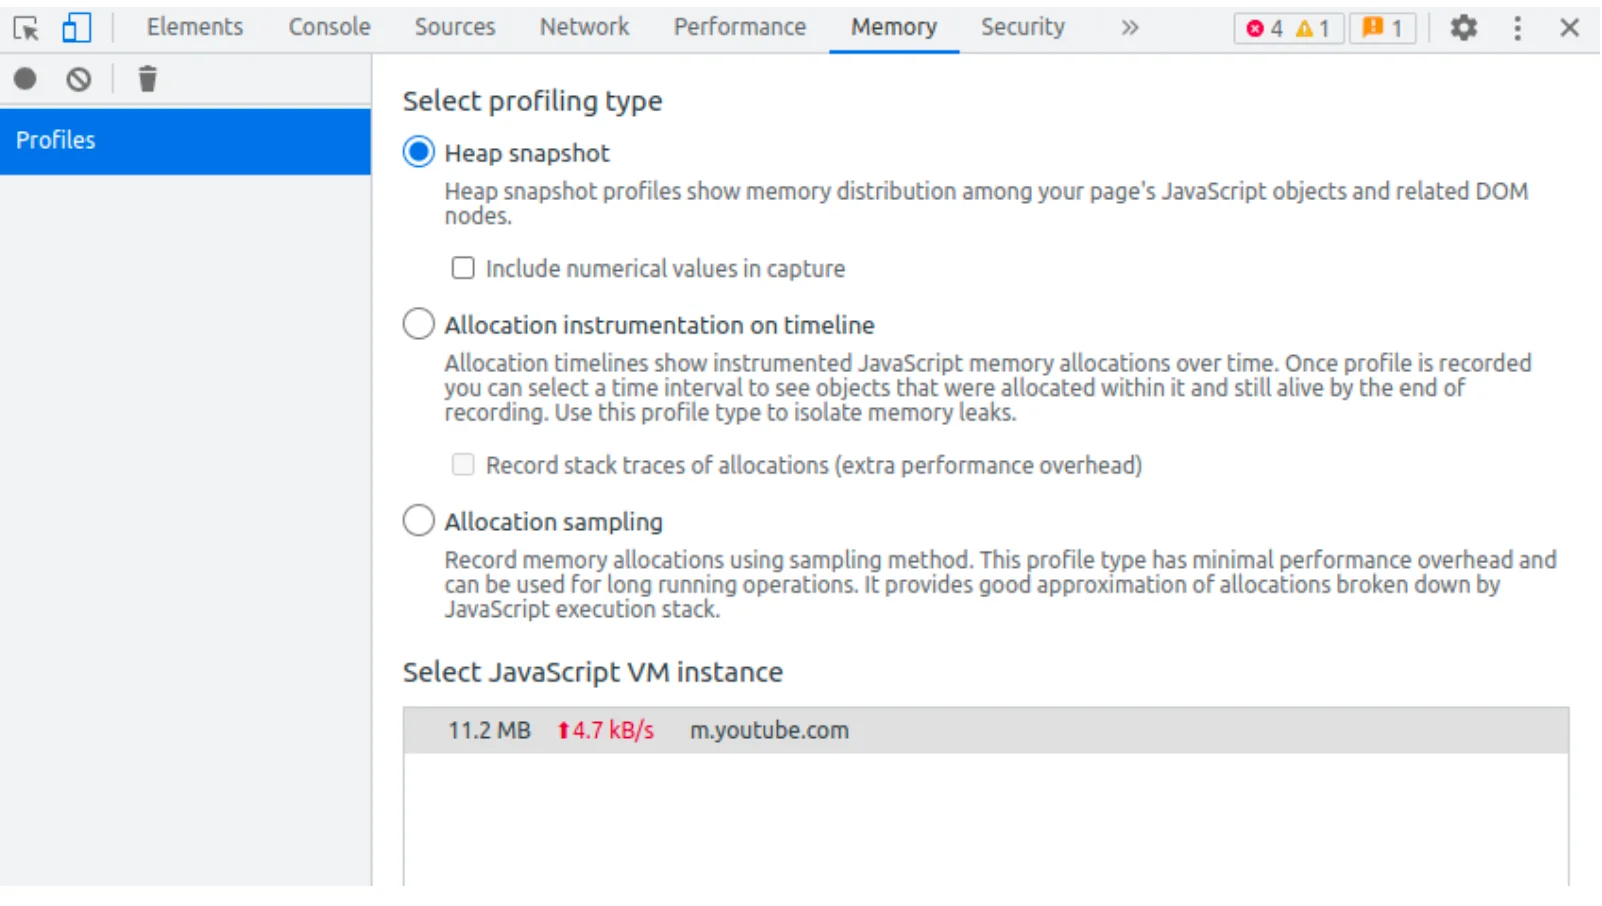
Memory
You can monitor how much memory your page is consuming in the Memory section. Also, which resources are using memory and where memory leaks are happening can be examined by using the Memory panel.
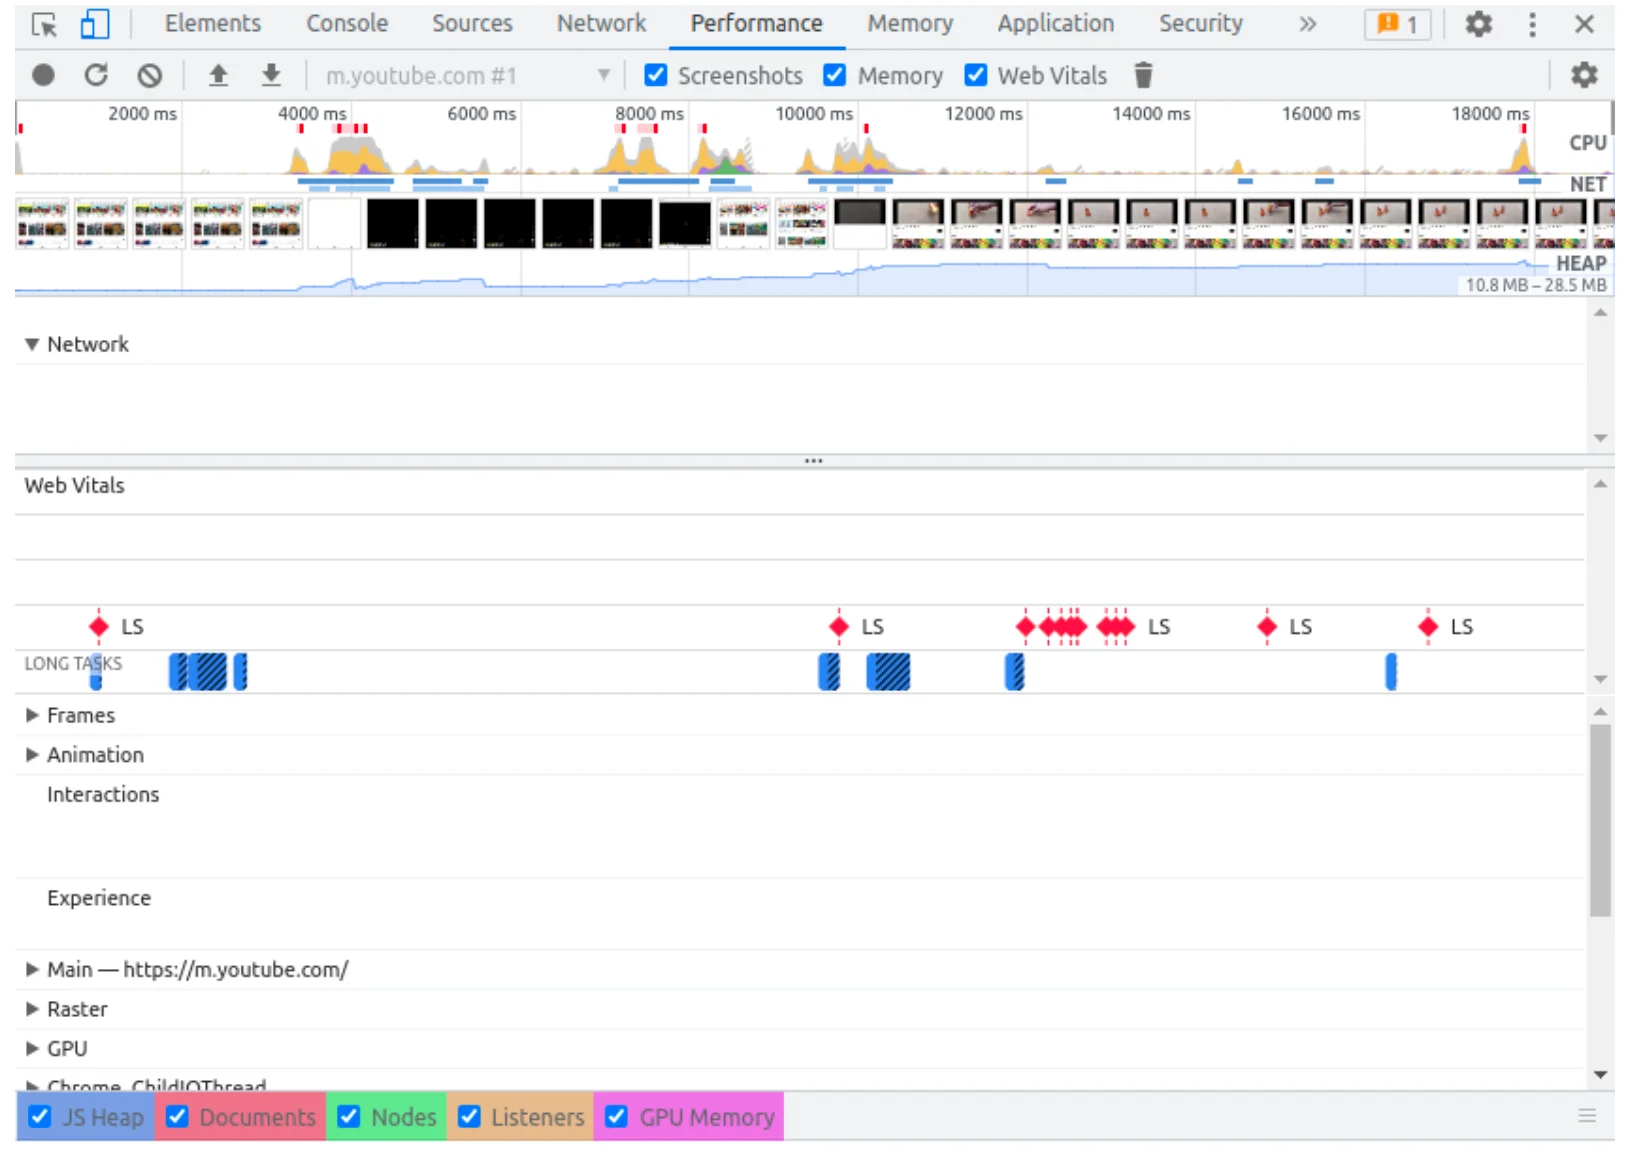
Performance
The Performance of web page can be measured using Performance panel. Network, memory, GPU memory and web vitals are some of the parameter on which the performance of the web page depends.
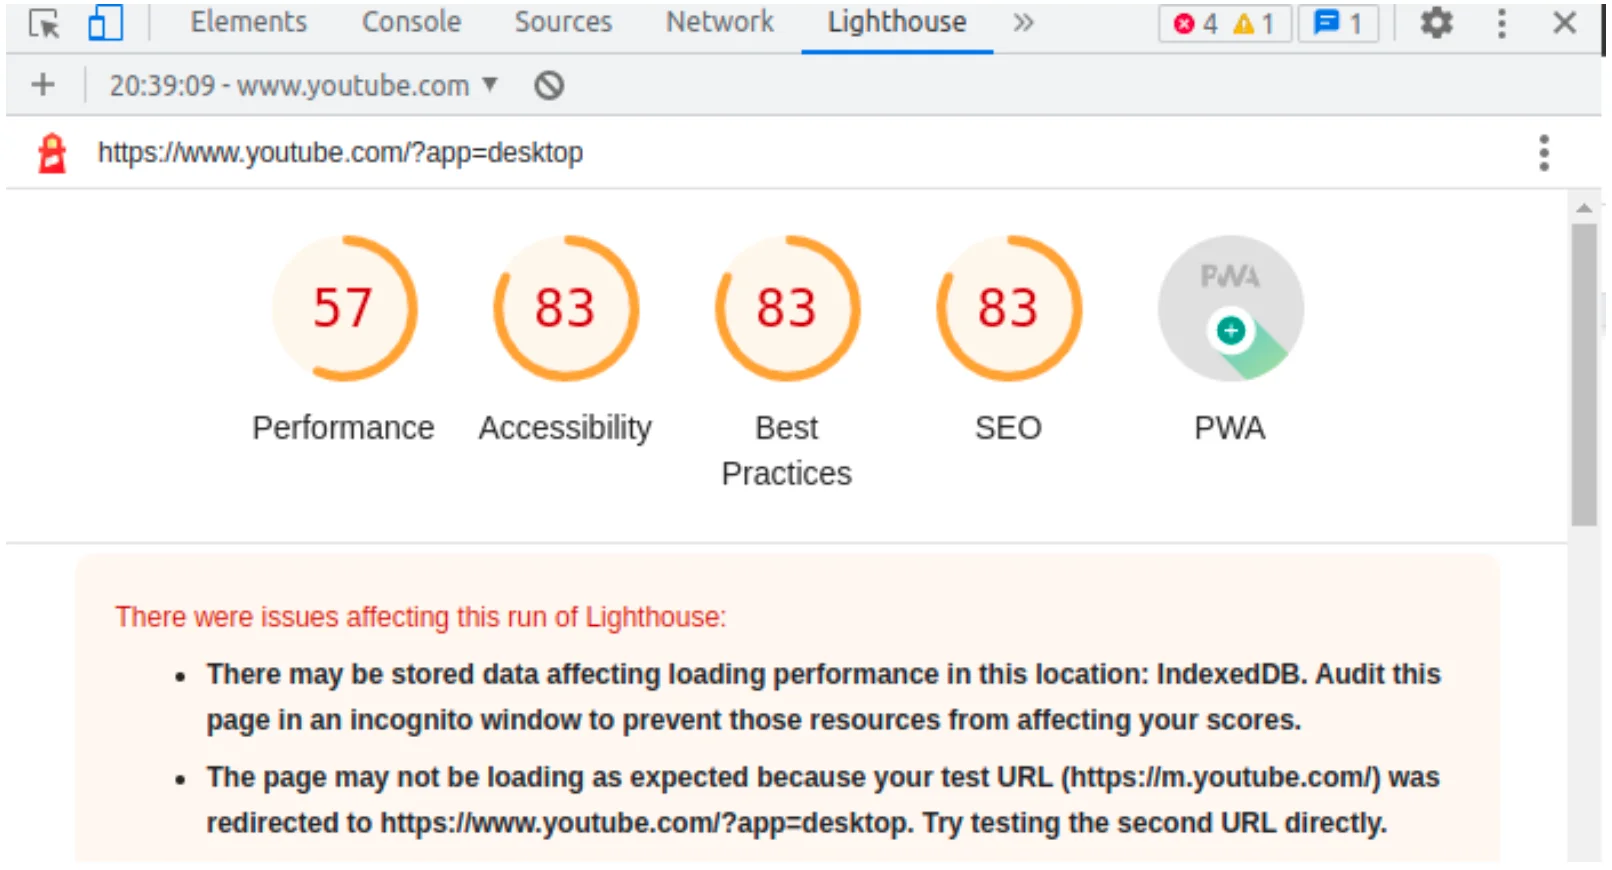
Lighthouse
The lighthouse panel automatically creates information on the structure and operation of websites to aid developers in performance improvement. It can provide analysis on performance, accessibility, best practices, search engine optimization (SEO) and progressive web app (PWA).
You can rearrange the positions of developer tools according to your convenience by using the chrome DevTools settings. Also, you can check responsiveness of web pages across variety of the devices.


